
Case Study
Sustainext — ESG AI Agent & Reporting Platform
An AI-integrated ESG platform where OCR and an LLM classification pipeline automate emissions data entry.
Visit live product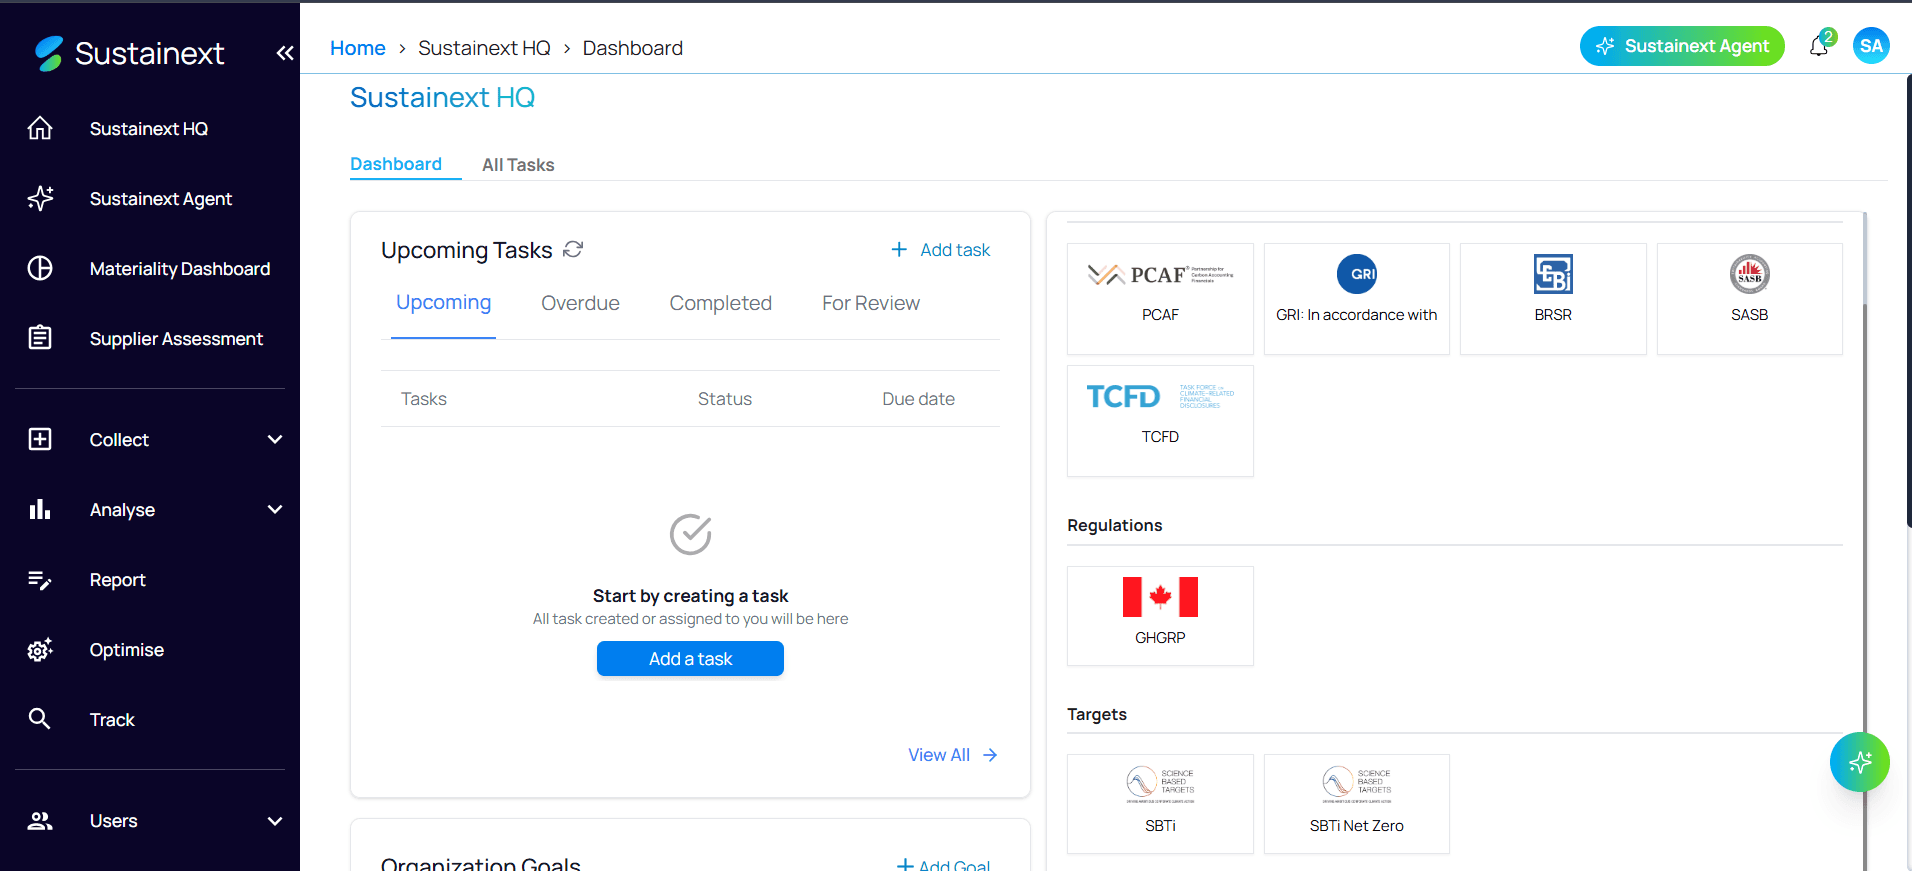
Lighthouse Score
Page Load Reduction
Manual Categorization Cut
Engineers Mentored
Overview
The story behind the build.
Business Goal
Sustainext needed a single platform where enterprise clients across multiple countries could track GHG emissions, manage ESG frameworks, and generate audit-ready disclosures — replacing spreadsheet-driven reporting, and the manual re-typing of utility bills and invoices, with a real-time, largely automated system.
The Problem
ESG data lived in disconnected spreadsheets, PDFs, utility bills and email threads. Reporting teams manually cross-referenced GHG Protocol scopes, disclosure frameworks (GRI, BRSR, SASB, TCFD, PCAF) and science-based targets (SBTi), then hand-typed every line item from source documents into the correct emission category — a slow, error-prone process that couldn't scale past a handful of clients.
My Solution
I led frontend architecture for a unified ESG workspace — a task-driven dashboard, a GHG 2.0 module covering Scope 1/2/3 emissions with per-category completeness tracking, framework and target libraries — and designed an AI agent pipeline that reads source documents directly: OCR extracts fields from bills and invoices, an LLM classifies each line item into the correct GHG category, and anything ambiguous gets flagged with a draft suggestion for a human to confirm rather than silently auto-filed.
Workspace
One dashboard for every ESG workflow
Upcoming tasks, disclosure frameworks, regulations and science-based targets surface on a single home dashboard — so a sustainability lead can see exactly what's overdue, what's calculated, and what still needs data without navigating five separate tools.
- Task-driven home dashboard
- Framework & target library
- Org-level goal tracking
GHG 2.0
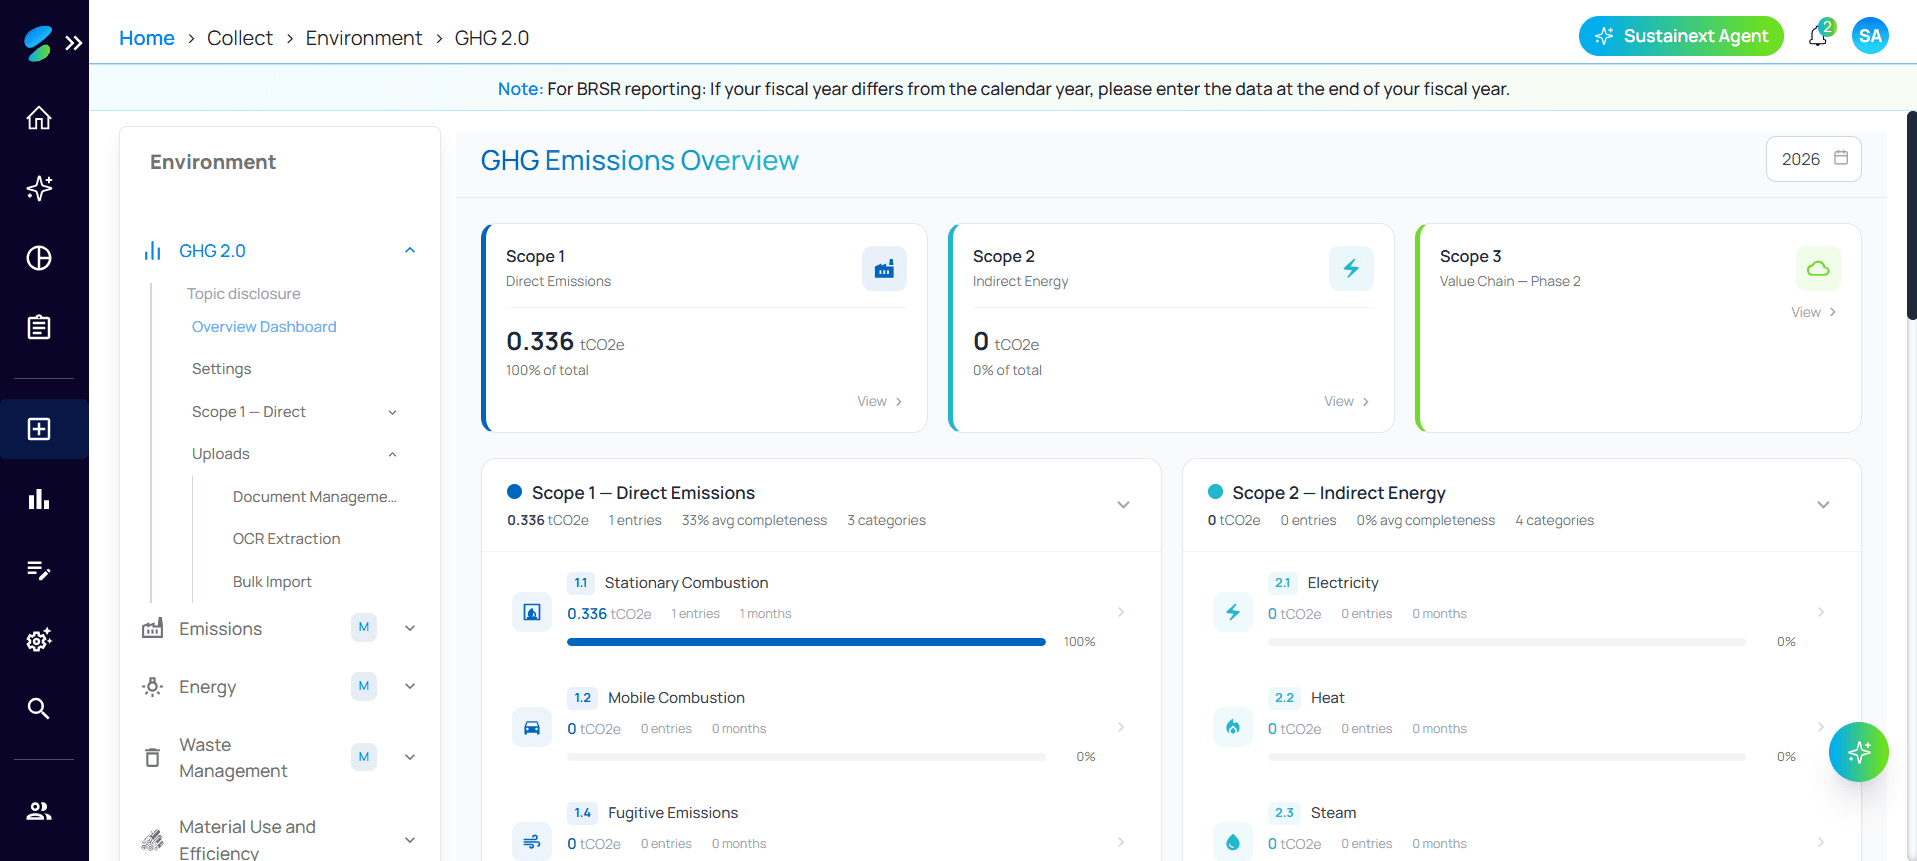
Scope 1, 2 and 3 emissions, broken down to the category
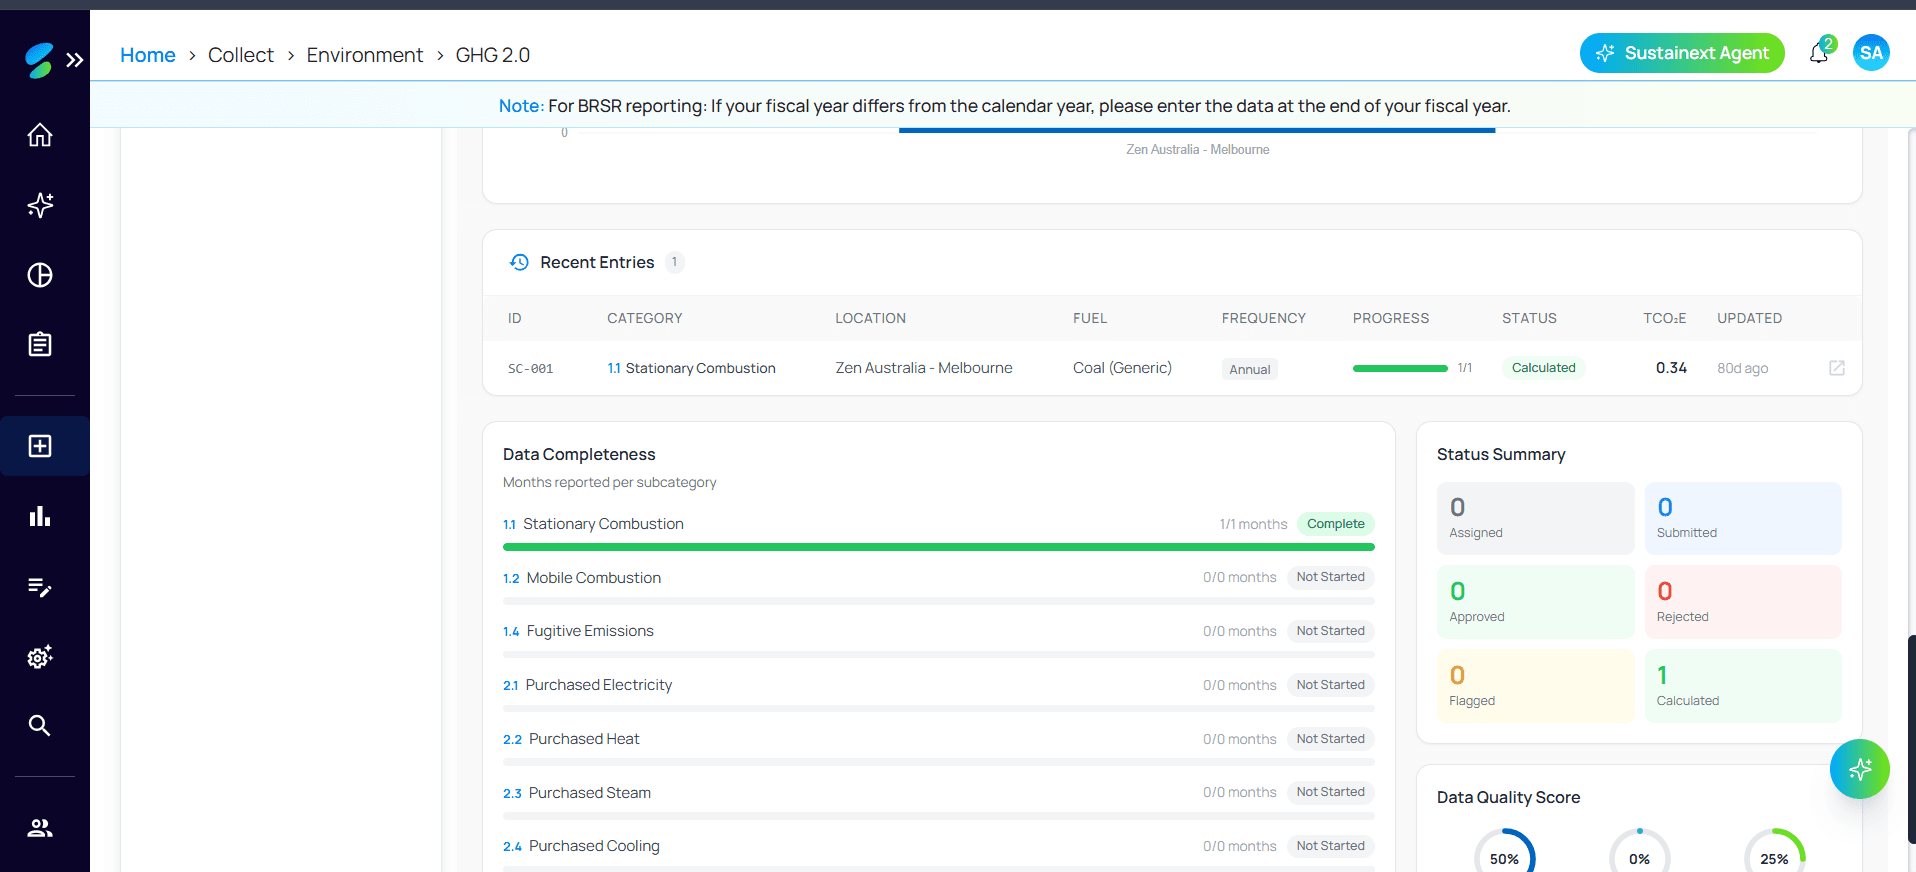
Each emissions category — stationary combustion, mobile combustion, electricity, fugitive emissions — gets its own completeness bar and calculated tCO2e total, rolled up live into the Scope-level overview cards.
- Per-category completeness tracking
- Live scope rollups
- Server-rendered totals on first paint
Analytics
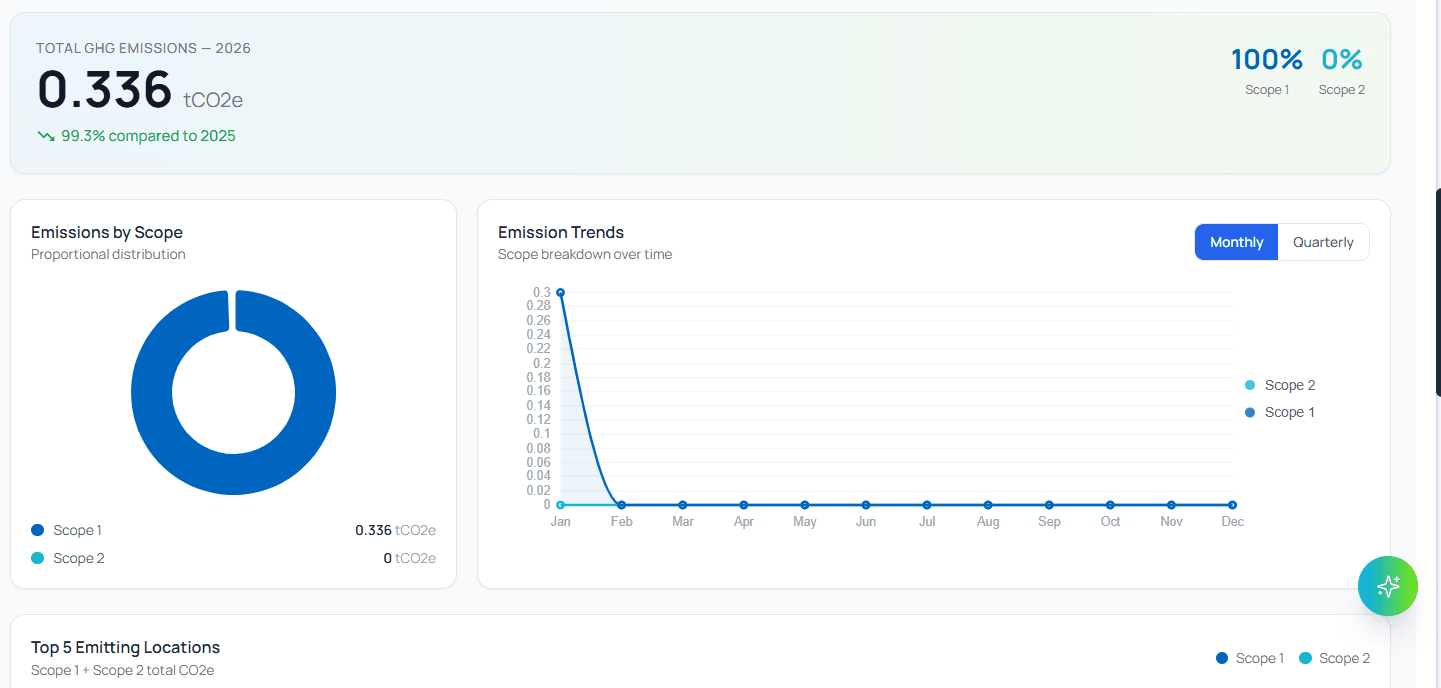
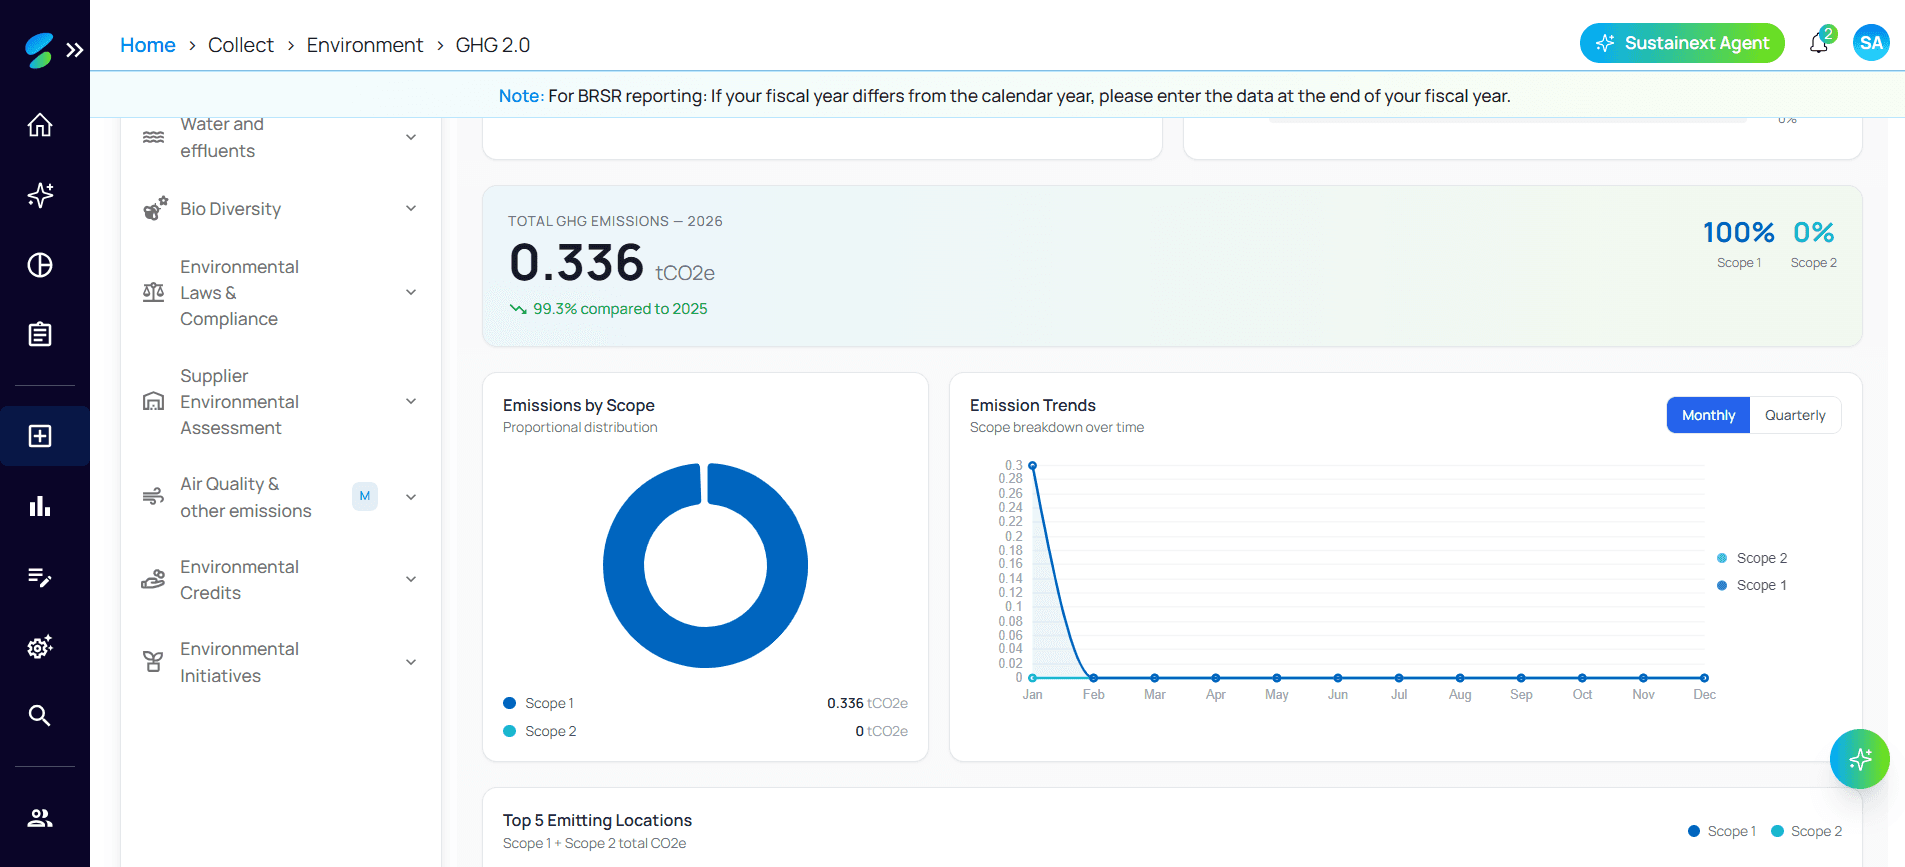
Emissions trends and year-over-year comparison
A donut breakdown by scope alongside a monthly trend line gives reporting teams an at-a-glance read on whether emissions are trending down before they ever open a formal report.
- Emissions-by-scope donut
- Monthly / quarterly trend toggle
- Compared to prior reporting year
Data Quality
Status tracking built for audit trails
Every entry moves through Draft → Assigned → Calculated → Submitted → Approved (or Flagged), with a data-quality score surfaced per category — so audit readiness isn't a last-minute scramble.
- Full entry lifecycle & status summary
- Data quality scoring
- Recent-entries audit log
Entry Management
Structured data entry per emission category
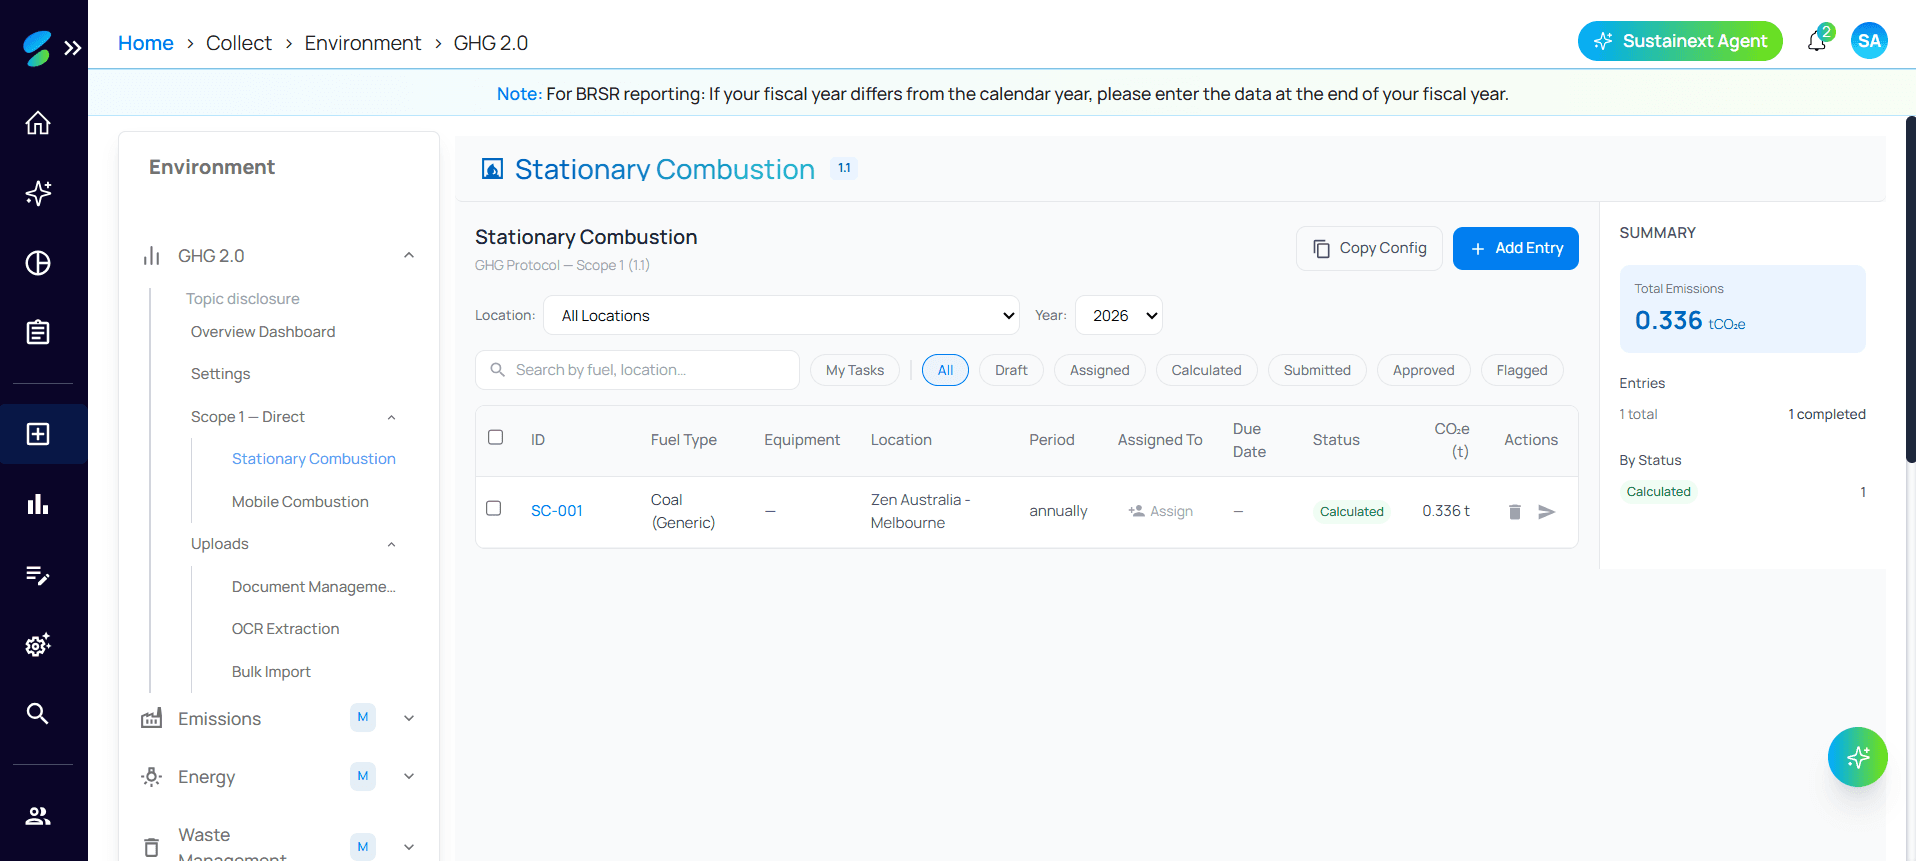
Stationary Combustion (and every other subcategory) has its own filtered table by location and year, with assignment, calculation status, and CO2e output tracked per row.
- Location & year filters
- Inline assignment workflow
- Per-entry CO2e calculation
AI Agent
OCR + LLM pipeline that files emissions data for you
Upload a utility bill or invoice and the AI agent extracts the fields via OCR, an LLM suggests the correct GHG Scope 1/2/3 category, and anything it's unsure about gets flagged with a draft suggestion for human review rather than filed blind. The same agent surfaces as an embedded chat assistant for natural-language questions about the resulting data.
- OCR extraction from bills & invoices
- LLM-suggested GHG categorization
- Low-confidence entries flagged for human review
Under the Hood
Architecture & integration.
Frontend Architecture
Built on Next.js 14 App Router with React Server Components for the dashboard shells and client components for interactive data grids and charts. Route-level code-splitting and dynamic imports keep the emissions module — the heaviest screen — out of the initial bundle. Shared layout state (sidebar, breadcrumbs, org context) is lifted into server-rendered layouts to avoid client-side waterfall fetches.
Backend Integration
The frontend consumes REST APIs (Node.js) backed by MySQL for emissions entries, task assignment, and completeness scoring. Scope-level rollups (e.g. the 0.336 tCO2e Scope 1 total) are computed server-side and streamed into SSR pages so the dashboard renders with real numbers on first paint instead of a loading skeleton. Legacy authentication was replaced with Azure AD (Entra ID) via OAuth 2.0/MSAL, giving enterprise clients SSO and enforcing role-based access control (RBAC) at both the API and UI layers.
AI Integration
The AI agent runs OCR over uploaded bills, invoices and supplier documents (Azure Form Recognizer, with Tesseract as a fallback) to extract structured fields, then an LLM-based classification step suggests the correct GHG Scope 1/2/3 category for each line item — cutting manual categorization effort by roughly 70%. Entries the model is unsure about are automatically flagged with a draft suggestion and routed to a human reviewer instead of being silently accepted, which is also what powers the embedded 'Sustainext Agent' chat assistant for natural-language questions about the resulting data.
Performance Optimizations
- ▸Lighthouse performance score improved from 62 to 91
- ▸Page load time reduced by 40% via SSR + code-splitting + lazy loading
- ▸OCR + LLM classification pipeline cut manual GHG categorization effort by ~70%
- ▸Azure AD SSO + RBAC replaced legacy auth at both API and UI layers
Tech Stack
Business Impact
The platform now serves enterprise clients across 3 countries with a single, auditable source of truth for emissions and disclosure data — turning a multi-week manual reporting cycle into a live dashboard where most line-item categorization happens automatically, with humans reviewing only the entries the model flags as uncertain.